


Habitat by Ecological Condition
The Highest Ranked Wildlife Habitat by Ecological Condition
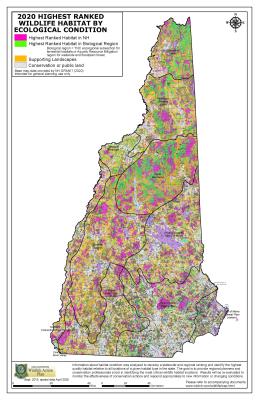 What is this map about?
This map shows where the wildlife habitat is in the best relative condition in New Hampshire, particularly for Species of Greatest Conservation Need. The analysis used a series of data on species locations, landscape setting and human influences that affect the ability of habitats to be used by wildlife. Using this combination of data allows for an analysis of habitat all across the state, and not just where we know rare species exist. The process we used for the 2020 update was similar to that used previously, but with improved habitat datasets, the addition of new species occurrence data, and the use of The Nature Conservancy's Resilient and Connected Network data to elevate areas to Tier 3 Supporting Landscape. A filtering process was run to remove small (< 1 acre) isolated areas of ranked habitat that were separated from contiguous habitat blocks due roads or development.
How can I access the Maps and Data?
The maps and associated data are provided in several formats:
- An Excel table format that shows the extent of each habitat type and habitat condition by town and ecoregion
- GIS data via the GRANIT website.
- GRANITView an online mapping service (useful for non-GIS users), has the map data available for you to view and include with other datasets. The maps you create can be printed from your computer.
What data was used?
We sorted data into three categories: biological, landscape and human influences. This analysis was used for terrestrial and wetland habitats. See the Aquatic Habitats data layer for a separate but similar analysis that was done for surface waters, at the reach scale instead of the HUC 2 scale as was used previously.
Biological Data
Information about the diversity of plants and animals in a given location is very limited. Some monitoring programs provide data about certain groups of wildlife, and many rare wildlife species are tracked by NHFG and the NH Natural Heritage Bureau (NHNHB). It is difficult or impossible to know whether the absence of records in a given location is an indication that surveys yielded no observations or whether no surveys were conducted. Many recorded observations of rare plants, animals, and natural communities are provided through incidental sightings, such as that you might provide through the Wildlife Sightings website. Because of this, other data must be used to assess the ability of habitats to provide for the needs of wildlife, and so the biological data is just one third of the score for habitat condition.
The biological data used for habitats included species richness of rare wildlife, species richness of rare wildlife within their dispersal distances (as determined by NHNHB and NatureServe), species richness of rare plants, and richness of exemplary natural communities. For matrix forests, a vertebrate species richness dataset based on the ranges of those species was used as an indicator of common species richness.
Landscape Context
The spatial arrangement of patches of different habitat types is important in understanding which places species can live and travel in and through. Data that help with this includes total area of the habitat patch, distance to nearest patch of the same habitat, similarity of neighboring habitat types, and other landscape features.
Several northeast regional condition assessments completed by The Nature Conservancy and the University of Massachusetts-Amherst were also applied. Landscape complexity provided an estimate of the number of micro-climates in a 100 acre area surrounding each cell (approximately ¼ acre) of habitat, based on the variety of landforms, the elevation range, and the density of wetlands. Some species have more particular needs for their habitat that cannot be mapped at this scale, but offering a variety of possibilities means that more species are likely to be able to utilize that habitat patch, even in a changing climate. Local connectedness estimates how easy it is for wildlife to move through a given area surrounding each cell.
Impacts of Human Activities
Impacts of human activities on habitats include the effects of development, roads and utility corridors, pollutants, direct habitat alteration that changes the type of habitat (clearcutting producing shrublands, for instance), and many others. Gathering statewide GIS data to show these impacts is not often possible. For human impacts, we chose data that, as best as possible, covered a variety of impacts.
Human development and infrastructure may have a variety of effects on wildlife, including reduced landscape connectivity, introduction of invasive species, contaminants, and modified local climate. To evaluate edge effects associated with fragmenting features on the landscape, UMass developed an Index of Ecological Integrity (IEI). IEI is a measure of relative intactness (i.e., freedom from human modifications and disturbance) and resiliency to environmental change (e.g., as caused by disturbance and climate change). Ecological integrity is defined as the ability of an area (e.g., local site or landscape) to sustain important ecological functions over the long term. These functions are primarily the ability to support biodiversity and the ecosystem processes necessary to sustain biodiversity. Various metrics are applied to the landscape and then integrated in weighted linear combinations as models for predicting ecological integrity.
In some habitats, other data was added such as road density near the habitat, distance to nearest road, presence of dams, and effects of recreation (trail density, rock climbing). The details can be found in the Wildlife Action Plan Map Analysis Information document.
How were the rankings developed?
Since so much of the habitat in NH scores pretty highly, we wanted a way to show which ranked the highest. There are three tiers of rankings, Highest Ranked in the State, Highest Ranked in the Biological Region, and Supporting Landscapes.
Highest Ranked in the State habitats include the top 15% by area of each habitat with a few exceptions. Especially rare habitats (alpine, dunes, saltmarshes, rocky shores) were include 100% to emphasize their importance. To ensure that the known critical habitats of state-listed species were included, we added that information as well.
Highest Ranked in the Biological Region compares the habitats within regions of the state that have similar climate, geology and other factors that influence biology. As you drive south to north in the state, you can see how different the landscape looks, so comparing the North Country to the southeast is not quite balanced. Within each biological region (calculated separately for terrestrial versus wet habitats) the top 30% of each habitat is included, except that that area already within the Highest Ranked in the State is kept as top ranked, with the rest added as Highest Ranked in the Biological Region. Some high priority natural communities as ranked by NH Natural Heritage Bureau were added to highlight the importance of plant diversity in habitat quality.
Supporting landscapes includes the remainder of the top 50% of each habitat areas mapped as part of the resilient and connected network by the Nature Conservancy.
Highest ranked lakes, ponds streams and rivers were included only as Highest Ranked in the State. Some other rare species occurrences were included in the rankings. For more details see the Wildlife Action Plan Map Analysis Information document.
How do I know what made my location highest ranked?
You can’t actually. Since the analysis is made up of many types of data, it is very hard to pick out one thing that makes a habitat top ranked. In some circumstances, it is one thing – mostly a known occurrence of an important species or habitat – but that information is not readily available to the general public in order to protect the species itself.
How do I use this information?
Since 2006, when the first rankings were done, land trusts, communities and agencies have used the maps in a number of ways. One top use is to prioritize parcels for land protection. We encourage you to use this data with other data that you may have or collect locally, as that sort of data – forest stand types, local wildlife sightings, recreational trails, scenic views, water resources and other local priorities – as part of the decision-making process.
Another use is in comprehensive conservation planning. For towns and land trusts, considering your whole geographic area prior to making decisions on everything from land protection to land management to zoning or regulatory changes is critical. Wildlife habitat can enhance the character of a town, provide protection from flooding, protect water resources, and provide educational opportunities for schoolchildren. Considering where the best habitat for those things are located in your town, so that both economic development and natural resources protection occur in the right places, is critical to the long-term quality of life in your town. The Taking Action for Wildlife program offers plenty of how-to’s on the website plus personalized help to communities.